
Insurance Data
Below are key facts and figures that illustrate how the General Insurance industry are safeguarding Malaysians, their families and their property against emerging and evolving risks. This data also highlights the vital role of general insurance in providing financial security and strengthening resilience across the nation.
The performance of Malaysia’s General Insurance (GI) industry is intrinsically connected to the nation's Gross Domestic Product (GDP) growth. The industry's resilience has been evident especially in recent years, as Gross Written Premium (GWP) has continued to grow alongside GDP, reflecting the industry’s ability to remain resilient despite changing economic conditions.
This positive momentum continued in 2024 and 2025, with both Malaysia’s economy and the GI industry recording year-on-year growth.
In 2025, the GI industry’s GWP increased by 4.8%, while Malaysia’s economy grew by 5.2%. Although the gap between GWP and GDP narrowed, the GI industry continued to deliver steady growth, demonstrating its resilience and adaptability. This performance underscores our industry’s ongoing role in supporting economic activity and helping individuals and businesses manage risk in an evolving environment.
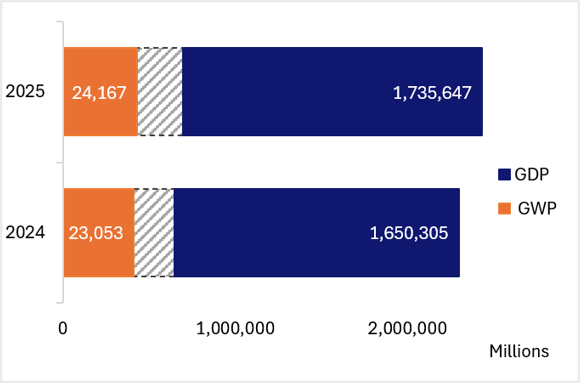
(Source: GDP – Malaysia’s National Statistics Organisation, as of 2025; GWP – ISM Circular Distribution System, as of Q4 2025)
Malaysia’s number of households grew from 8.9 million in 2023 to 9.1 million in 2024, reflecting continued residential and household growth. Despite this growing population base, the GI penetration rate stood at 1.5% in 2024. This indicates that the increase growth in the number of households does not automatically translate into higher insurance uptake, as affordability concerns, limited insurance awareness, and a low perceived need for insurance beyond the mandatory minimum coverage imposed by property loan financiers continue to discourage many households from purchasing coverage. Consequently, the low penetration rate highlights a significant opportunity for insurers to expand coverage and increase market penetration among Malaysian households.
Among selected Asian markets including China, India, Indonesia, the Philippines, Thailand, and Vietnam; Malaysia ranked third in penetration rate, which is a positive step up from 1.4% in 2023 to 1.5% in 2024.
While the growth may appear modest, it reflects steady progress in insurance adoption. Malaysia’s position ahead of several regional peers highlights the relative maturity of its GI sector, while also signalling opportunities for further growth when benchmarked against higher-penetration markets such as China and Thailand. Continued efforts to boost consumer education on insurance awareness, its benefits, affordability, and accessibility remain key to driving further growth.
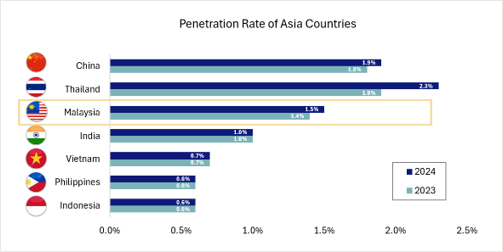
(Source: Penetration rate - Swiss Re Sigma 3/2024 Report & Swiss Re Sigma 3/2025 Report)
The GI industry’s premium distribution is primarily concentrated across 6 key lines of business: Motor, Fire, Miscellaneous (MISC), Marine, Aviation and Transit (MAT), Personal Accident (PA) and Medical and Health Insurance (MHI).
This distribution reflects both consumer protection needs and business risk coverage trends across the GI market.
To better understand the contribution of each business line, the premium distribution across the six major segments is examined. Malaysia’s GI industry recorded 5.0% increase in GDP in 2025, reflecting continued demand across all major lines of business. Motor insurance remained the largest contributor, accounting for 46.2% of total GDP, followed by Fire insurance at 20.3%. Together, these two classes represented more than two-thirds of the total premium, highlighting the continued importance of vehicle and property protection. This strong performance was driven by rising vehicle ownership and ongoing residential and commercial development.
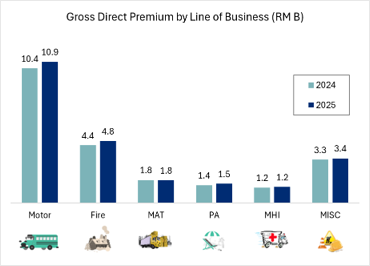
(Source: ISM Insurance Services Malaysia Berhad, data as of Q4 2025)
*MISC: Includes workmen’s compensation, liability, bond, and other miscellaneous insurance.
The remaining lines of business also contributed to the industry’s overall performance. MHI classes accounted for 5.2% of total GDP, followed by PA at 6.3%, MAT at 7.4% and MISC at 14.6%. This diversified portfolio reflects the industry’s broad role in supporting both personal and business risk protection needs, with Motor and Fire continuing to anchor overall growth.
A closer look at general insurers’ underwriting results reveals key performance indicators such as Net Claims Incurred (NCI) Ratio, and the Combined Ratio (CoR). These metrics provide a comprehensive picture of industry profitability and operational efficiency.
The GI industry maintained stable underwriting performance in 2025, with the Combined Ratio remaining at approximately 93%. Supported by improved claims experience and disciplined cost management, the industry recorded an underwriting profit of RM 1.2 billion, reflecting continued profitability and operational efficiency.
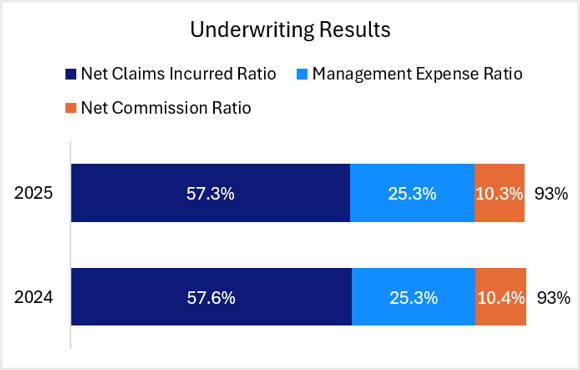
(Source: ISM Insurance Services Malaysia Berhad, data as of Q4 2025)
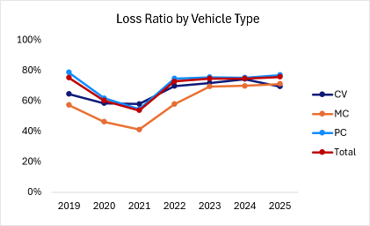
Motor Insurance for Private Cars (PC), Motorcycles (MC) and Commercial Vehicles (CV), remains a core component of the general insurance retail segment. Recent trends highlight changes in loss ratio, claim frequency, and claim severity, reflecting the evolving risk landscape and claims experience.
Loss Ratio
Loss ratio measures the proportion of premiums paid out as claims and serves as a key indicator of underwriting performance. In 2025, Motor claims performance was largely driven by the Private Car (PC) segment.
Claims Frequency
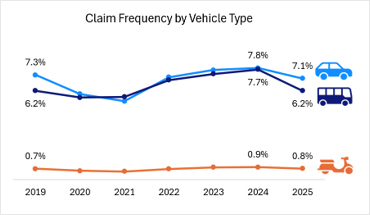
Claim frequency measures how often insured vehicles are involved in accidents or losses. In 2025, the PC segment recorded a claim frequency slightly above 7%, reflecting greater exposure to a younger driver demographic aged less than 30.
Claims Severity
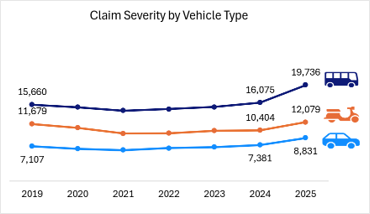
Claims severity measures the average cost of each claim, particularly those involving major vehicle repairs or bodily injuries. In 2025, the PC segment recorded an average claim severity of RM8,831, a 20% increase from 2024. This rise was primarily driven by spare parts inflation, leading to higher vehicle repair costs.
The fire insurance market has remained generally stable, although claims experience continues to be influenced by major loss events and changing risk exposures.
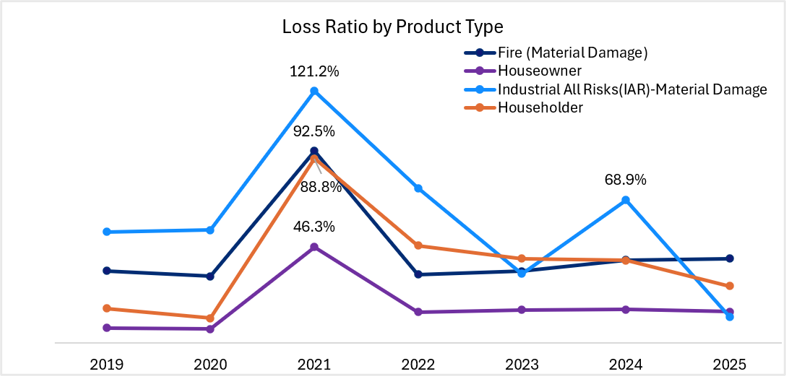
Loss ratio is a key measure for underwriting performance, indicating the proportion of premiums paid out as claims. A higher loss ratio reflects greater claims costs relative to premiums collected. In 2021, all four fire insurance product categories recorded a significant increase in loss ratios due to the Great Flood in the Klang Valley. In 2024, the Industrial All Risks (IAR) – Material Damage segment recorded a sharp increase in its loss ratio to 68.9%, primarily driven by higher claims frequency. This suggests a broader rise in the number of insured incidents, potentially reflecting increased industrial activities and clusters of loss events, rather than the impact of a one-off catastrophic event.
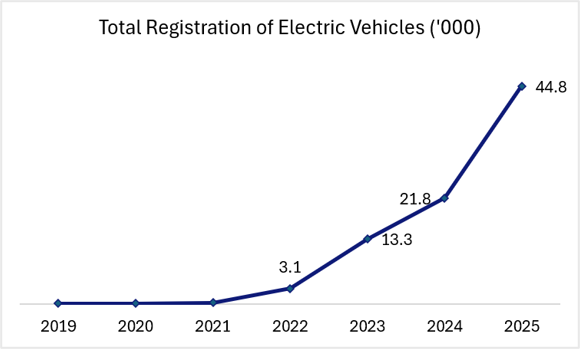
Malaysia’s transition towards electric mobility is gaining momentum, supported by the Government’s push to accelerate Electric Vehicles (EV) adoption as part of the nation’s sustainability agenda. As a result, EV registrations have continued to grow at a remarkable pace.
In 2025, EV registrations more than doubled, increasing by an impressive 106% growth, from 21,789 vehicles in 2024 to 44,813 vehicles. This rapid growth reflects rising consumer confidence, expanding charging infrastructure, and an increasingly competitive EV market.
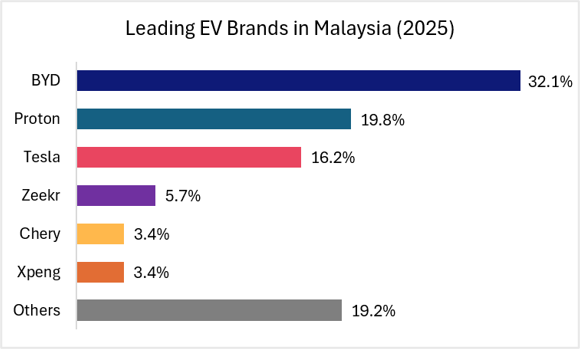
As the market matures, registrations are becoming concentrated among several leading brands. In 2025, BYD accounted for 32.1% of total EV registrations, followed by Proton (19.8%) and Tesla (16.2%). The growing presence of both established global manufacturers and emerging players has expanded consumer choice, while increasing demand for more affordable and accessible EV models.
(Source: Malaysia’s Official Open Data Portal, as of Dec. 2025)
The rapid expansion of the EV market is also reshaping Malaysia’s general insurance landscape. As EV ownership continues to rise, insurers are presented with new opportunities while navigating a fundamentally different risk profile compared with the conventional internal combustion engine (ICE) vehicles. Battery systems, software integration, and Advanced Driver-Assistance Systems (ADAS) introduce unique underwriting and claims considerations that require specialized expertise and risk assessment.
(Source: Malaysia’s Official Open Data Portal, as of Dec. 2025)
Recognising these emerging challenges, the insurance industry is proactively strengthening its capabilities to support the transition towards electric mobility. Insurers are partnering with regulatory bodies to develop a certified network of workshops equipped with the specialised skills, tools, and infrastructure required to repair EVs, while enhancing the collection of EV specific information to improve underwriting and claims management. Together, these initiatives are strengthening the industry’s readiness to support the growing EV market and ensuring that Malaysia’s insurance ecosystem evolves alongside the nation’s transition toward sustainable mobility.
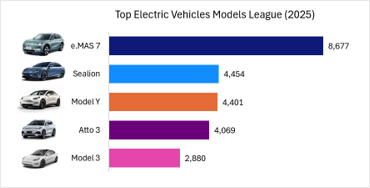
A closer look at individual EV model registrations provides valuable insight into consumer preferences and the evolving market dynamics within Malaysia’s EV landscape. Building on the strong growth in overall EV registrations, several car models emerged as market leaders in 2025.
(Source: Malaysia’s Official Open Data Portal – Vehicle Registrations, as of Q4 2025)
Malaysia’s national automaker maintained its strong position in the market, with the Proton e.Mas 7 recording 8,677 registrations, making it the country’s best-selling EV model. International manufacturers also continued to drive EV adoption, with BYD Sealion registering 4,454 units, followed by the Tesla Model Y at 4,401 units. Other top-selling models included the BYD Atto 3 with 4,069 registrations, while the Tesla Model 3 rounded out the top five with 2,880 units.
The strong performance of both local and international brands reflects the increasingly competitive and diverse nature of Malaysia’s EV market. Competitive pricing, diverse model offerings, and supportive government policies, continue to encourage consumer adoption and shape purchasing decisions.
As EV ownership continues to expand, these market developments not only support Malaysia's transition towards sustainable mobility but also create new opportunities and evolving challenges for the insurance industry. Differences in vehicle technology, repair requirements, and replacement costs across EV models underscore the importance of developing insurance products and claims capabilities that are tailored to the unique characteristics of electric vehicles.
Disclaimer:
This publication is provided by PIAM for general information only. The information is based on aggregated industry-level data and publicly available sources and does not represent the position, performance, or practices of any individual insurer.
The contents of this publication do not constitute financial, legal, underwriting, commercial, or professional advice and should not be relied upon for decision-making purposes.
References to electric vehicle manufacturers, brands, and models are based on publicly available information and are included solely for informational purposes. All trademarks and brand names remain the property of their respective owners. Their inclusion does not imply any endorsement, affiliation, or sponsorship by PIAM.
While reasonable care has been taken in preparing this publication, PIAM makes no representation or warranty as to its accuracy, completeness, or timeliness and accepts no liability for any loss arising from reliance on it.
Financial Year
12-month accounting period that a business uses for financial and tax reporting purposes.
Compound Annual Growth Rate
Annualized rate of return of a financial metric over a defined period.
Combined Ratio
Measures the profitability and financial health of an insurance company.
Combined Ratio
=
Net Claims Incurred + Net Commission + Management Expenses
Net Earned Premium
Gross Direct Premium
Total amount of premiums collected by direct insurance business without deduction for commission or brokerage.
Gross Written Premium
Total amount of premiums that an insurance company has charged for policies issued.
Management Expenses
Expenses incurred in the administration of an insurer which are not included for settling claims.
Net Claims Incurred
The total amount of claims paid is adjusted by the change in the claims provision.
Net Claims Incurred Ratio
Measures the proportion of claims incurred to earned premiums.
Net Claims Incurred Ratio
=
Net Claims Incurred
Net Earned Premium
Net Commission
Fee paid to an agent or broker as a percentage of the premium.
Net Earned Premium
Amount of premiums that an insurance company recognizes as earned revenue based on the time elapsed.
Penetration Rate
Indicates the level of development of insurance sector in a country.
Penetration Rate
=
Premium
Gross Domestic Product
Motor
Protects the individual against financial losses in the event of an accident involving private car, motorcycle, and commercial vehicle.
Fire
A type of property insurance that provides financial protection against losses caused by fire and special perils, where applicable.
Personal Accident
Provides compensation in the event of injuries, disability or death caused solely by violent, accidental, external and visible events.
Medical and Health
Covers the cost of private medical treatment, such as the cost of hospitalization and healthcare services.
Marine, Aviation and Transit
Covers the loss of marine cargo, air cargo, land transit, marine hull, operation of aircraft and oil and gas exploration.
Miscellaneous
Refers to workmen’s compensation, liability insurance, bonds and other types of insurance not falling within any of the above classification.